Instructions for PUBH 610 AT2
For AT2 you will need:
- The Social Health Atlas which is the dataset in excel that you need to analyse.
- The “Instructions for PUBH 610 AT2” doc which explains how to do the assessment.
These resources are in the ‘AT2 Resources section’ on LEO.
First some terminology.
In PUBH 610 we have been talking about the social patterning of disease. By this is meant that people of low socio economic status tend to have high rates of disease. In epidemiology, measures of socioeconomic status are called ‘exposures’ and measures of ‘disease’ are called ‘health outcomes’. Both ‘exposures’ and ‘diseases’ can be called ‘health indicators’.
‘Exposures’ are often related to ‘diseases’. Here are some examples of ‘exposures’ that are related to ‘disease’:
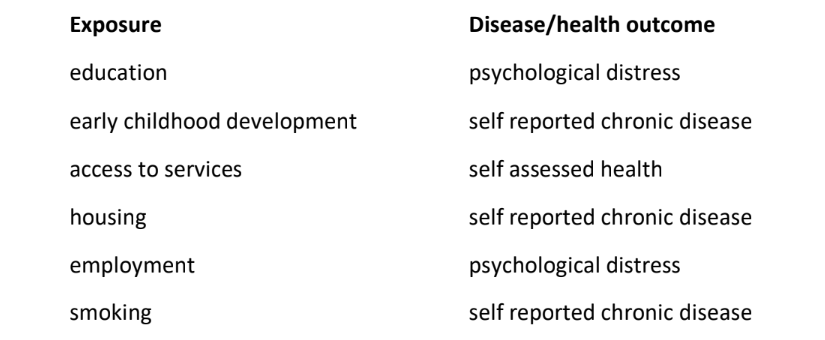
The Social Health Atlas contains several “exposure’ variables and several ‘disease/ health outcomes’ variables.
Step 1 In your Introduction, introduce the concepts of inequality and inequity. Give citations.
Step 2 Then introduce two health indicators that are related in the literature. These should reflect the social patterning of disease such as education (health indicator 1) and psychological distress (or self reported chronic disease/CVD/diabetes etc) (health indicator 2) OR employment and psychological distress (or self reported chronic disease/CVD/diabetes etc) OR smoking and self assessed health (or self reported chronic disease /CVD etc).
Step 3 Then go into the Social Health Atlas and look at the distribution of your chosen exposure across Vic. You will find inequality. This is often across urban vs rural areas. I want you to generate a histogram showing this inequality.
Step 4 Then look at the distribution of your disease across Vic. Generate a histogram.
Step 5 Then compare the histogram pattern in the exposure with the histogram pattern of the disease. If the patterns are matching, it tells you that the exposure may be related to the disease. That is, in areas of low education (say), there are high rates of psychological distress (say). This confirms the socio-economic patterns of disease that we know is in the literature.
Step 6 In the Data analysis section of your assessment, present your histograms along with comments about matching patterns (or not matching patterns) and what this implies.
Step 7 In your Discussion section, refer to the scientific literature that has also demonstrated this association (of low education and high psychological distress say). Note that your data analysis is aligned with this literature. If it is not aligned, note this as well. Also comment inthe discussion on whether these inequalities are likely to be inequitable. (“Differences in education access are inequitable…”)
Step 8 Write a conclusion that brings it together.
That is AT2. Please refer to the AT2 rubric in the Extended Unit Outline.
Do you need help with this assignment or any other? We got you! Place your order and leave the rest to our experts.